A recap of the day's key themes and the data behind them. Hallam Conference Centre, London | 30 September 2026
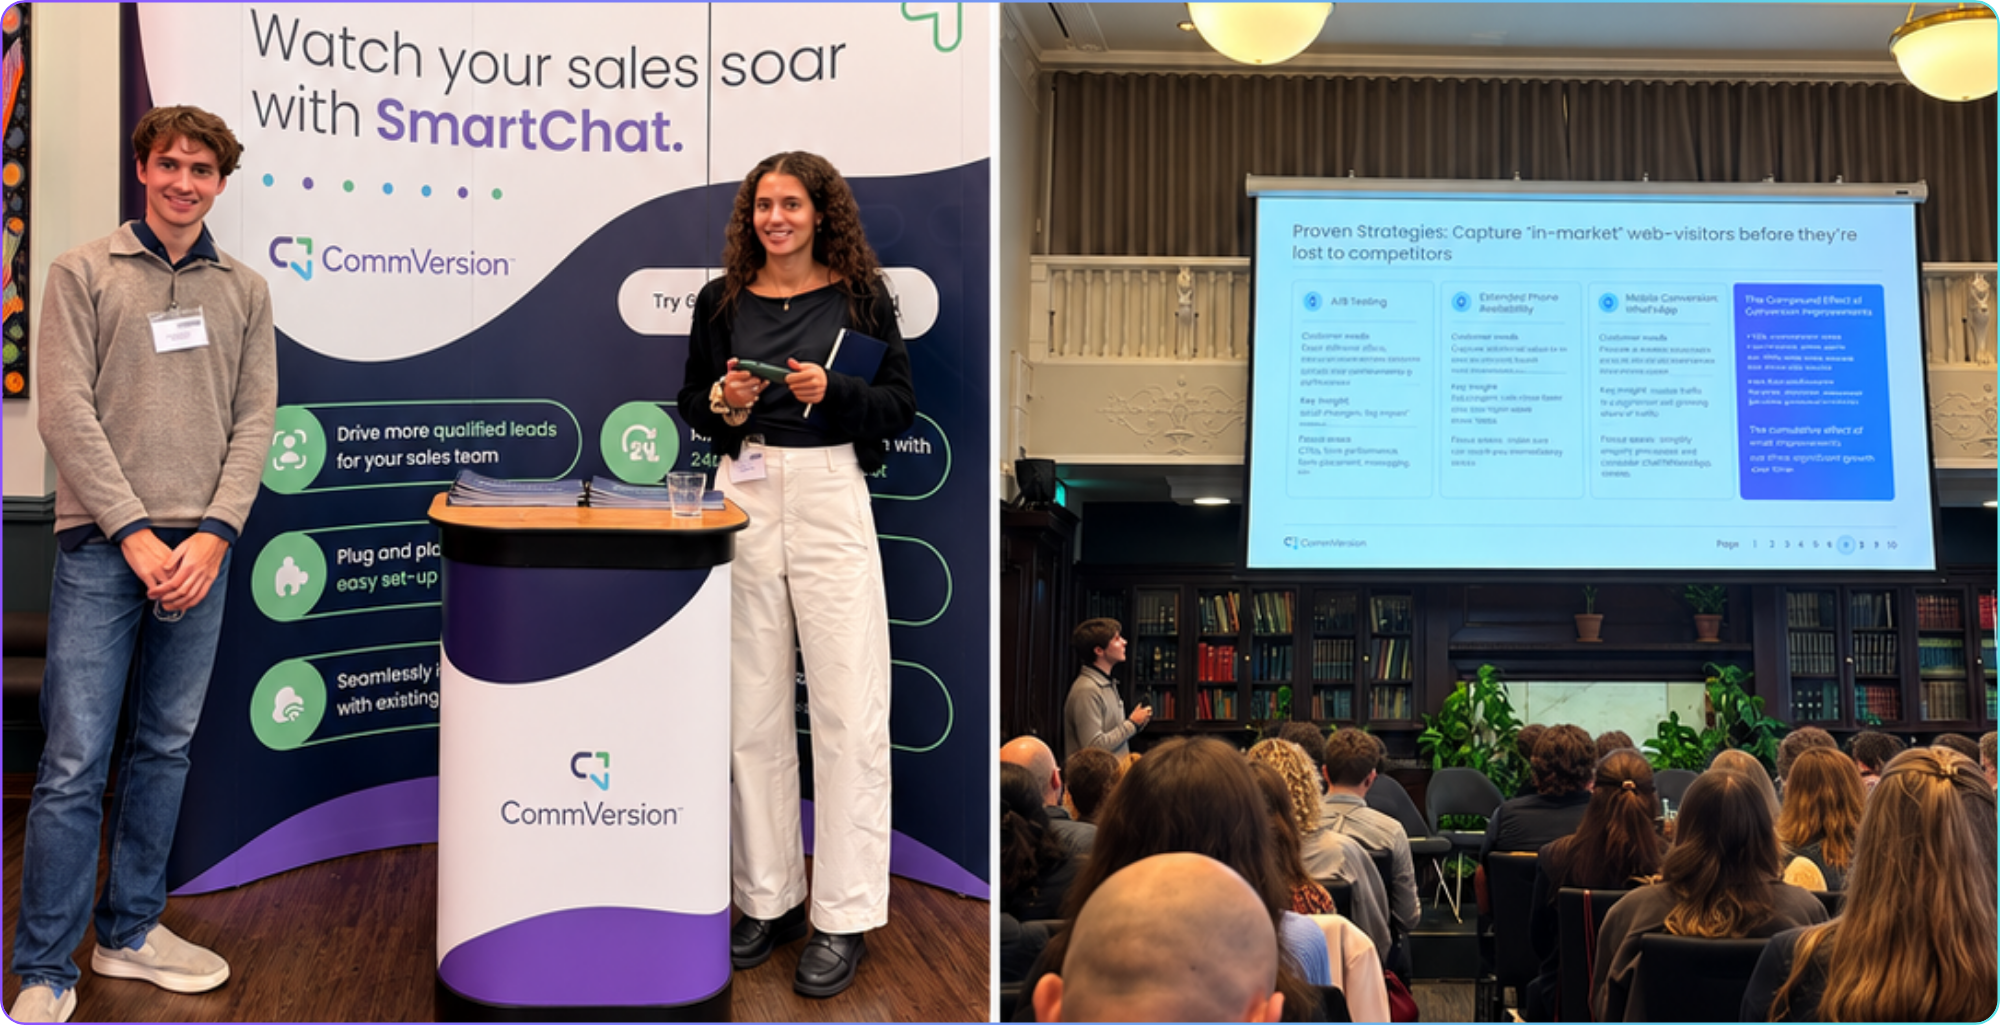
Maya Goddard and Cameron Dunning at the CommVersion stand.
Why Travel Marketers Come to London Every September
The Digital Travel Marketing Conference is the UK's leading annual gathering for senior marketing professionals working in travel, tourism and hospitality. Now in its eleventh year, the event brings together chief marketing officers, digital directors, performance marketing leads and agency strategists from some of the most recognised brands in the industry.
The sessions are built around people who are actively managing large budgets, making attribution decisions and running campaigns at scale. That is what gives the agenda its credibility, and what makes it the event where the most commercially serious conversations in UK travel marketing happen.
Themes That Came Through on the Day
Alongside the CommVersion session, the conference covered a wide range of ground. Maya Goddard, Account Executive at CommVersion, attended across the full day. A few things stood out to her.
The traditional funnel is harder to define than it used to be
"Travellers are researching across more places than before, using traditional search, social media, creators and AI. As a result, they are often arriving on a brand's website far more informed than they would have been previously. The customer journey has not disappeared, but it has definitely become more fragmented."
— Maya Goddard
One data point grounded this observation more than any other. In 2013, travellers visited an average of 38 web pages before booking a trip. By 2025, that number had risen to 277. The customer is doing more research, across more channels, before they ever make contact with a brand. As Maya put it, that single figure tied a lot of the day's conversations together.
Brand and performance are converging
Multiple sessions touched on the relationship between brand investment and performance marketing, particularly as organic traffic patterns shift and businesses look beyond the traditional Google ecosystem. The consensus that emerged was that the two are no longer separate conversations. Brands that are pulling ahead are managing both together.
AI is changing marketing. The human element is not going anywhere.
There was substantial discussion around where AI can create efficiencies, from content creation to search to customer experience. But the strongest use cases discussed were about using AI to enhance people rather than replace them.
"The fundamentals have not changed. Know your audience, understand what matters to them, and make sure you're present where they're actually researching and making decisions. It is easy to get caught up in the evolving technologies around us, but what became clear is that those fundamentals remain the same."
— Maya Goddard
In travel, where trust, expertise and human interaction play a significant role in the purchase decision, this distinction matters more than in most sectors.
Conversion matters more than it used to
The theme that ran underneath almost every session was this: acquisition is getting harder and more expensive. And that shifts the commercial emphasis toward what happens once the visitor is already on the site. This is where the CommVersion session came in.
The CommVersion Session: The Data Behind the Conversation
Bertie Horne and Cameron Dunning took to the stage at 11:30 with a session that put numbers behind what the rest of the day had been circling. It was built on a decade of CommVersion performance data across more than 400 lead generation businesses and more than 2 million real website conversations.
"Small changes within the metrics like Cost Per Click, Website Conversion Rate and Lead-to-Booking rates can compound and drastically affect a brand's ability to grow efficiently. With more pressure than ever on CPCs and CPLs, we talked about how the marketing leaders we are working with are continuing to thrive by maximising their site conversion and lead-to-booking rates."
— Cameron Dunning, Account Executive
The session drew on a decade of CommVersion performance data across 400+ lead generation businesses and more than 2 million real website conversations. The full analysis is available to download at the end of this piece.
The marketing equation every CFO understands
The session started from the flow that connects spend to revenue. It is reductive. It is also foundational. Understanding it is the precondition for fixing it.
£10k PPC > CPC > Visitors > Conversion > Enquiries > Close Rate > Bookings and Revenue
Historically, this equation worked reliably in luxury travel. A £10,000 PPC investment could reasonably generate sixteen bookings, £48,597 in revenue and a return on ad spend of 486%. The structure of that equation has not changed. The variables driving it have moved significantly.
The Findings: Three Variables Moving in the Wrong Direction
CommVersion's data points to sustained and compounding pressure across all three critical variables. The causes are structural, not cyclical, and understanding them as such matters for how marketing teams respond.
| Variable | Change | Why |
|---|---|---|
| CPC | +39% | Over three years. More advertisers chasing the same high-intent travel searches. |
| Conversion | -13.2% | Research behaviour has exploded. Visitors browse more and commit less. |
| Close rate | -10.3% | More comparison shopping before decisions. The research window has widened. |
The compound effect
Taken alone, a 13% drop in conversion or a 15% rise in cost per click might feel manageable. The problem is all three are moving simultaneously, and their effects multiply rather than add.
A 15% rise in CPC, a 13.2% fall in site conversion and a 10.3% decline in close rates do not sum to a 38% revenue impact. They compound. The same £10,000 investment that once generated sixteen bookings now generates eleven.
Customer acquisition cost rises from £617 to £912. Revenue falls from £48,597 to £32,982. ROAS drops from 486% to 329%. The spiral that follows is well known: higher CAC makes growth uneconomical, forcing budget cuts that further depress performance or driving overinvestment in unprofitable channels.
The good news is that this spiral is not inevitable. The same compound mechanics that work against marketers in declining conditions work powerfully in their favour when variables move in the right direction.
The Opportunity: Where 97% of Your Visitors Go

Cross-browsing behaviour patterns across luxury travel websites (SimilarWeb).
97% of visitors to luxury travel websites leave without making an enquiry. The instinct is to read this as evidence of low intent. The data tells a different story.
SimilarWeb data presented in the session shows that between 30% and 34% of visitors to a given operator's site go on to visit a direct competitor within the same browsing session. Not after a period of reflection. Minutes later. These are in-market buyers comparing products and moving toward a decision.
The question is not how to reach more new visitors. It is what happens to the in-market visitors already on your site right now, before they move on to someone else.
CommVersion's own conversation data reinforces this. 32% of luxury travel website chat interactions result in a qualified lead. 40% of those who engage are willing to be connected directly with a sales consultant in real time. A conservative shift from a 3% site enquiry rate to 3.6% is a 20% increase in enquiries from identical traffic and spend. No additional media investment required.
What the Top Performers Are Doing
Based on CommVersion's work across more than thirty luxury travel and cruise operators, three areas of tactical focus consistently produce measurable conversion improvement.
1. Systematic A/B testing
The most effective conversion testing is not cosmetic. Changing button colours rarely moves the needle. What does move the needle is structured testing of the elements that govern the enquiry journey: call-to-action placement and copy, phone number prominence, form length and field order, and the messaging that frames the enquiry ask. One operator saw a 15% conversion lift through four months of structured split testing across these variables.
Client result: 15% conversion lift over four months
2. Extended phone availability
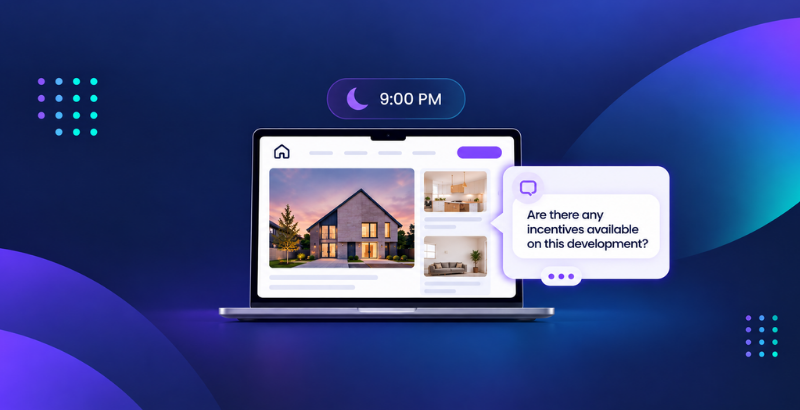
Phone enquiries close at significantly higher rates than form submissions, 19.4% versus 9.2% in CommVersion's dataset. The standard assumption is that phone leads have higher intent. The evidence points to a simpler explanation. An operator that extended its call-handling to 8:30pm saw an 18% increase in conversion rate during those extended hours. The demand was already there. The coverage was not.
Client result: 18% conversion uplift during extended hours
3. Mobile conversion optimisation
Mobile traffic accounts for more than 70% of visits across most luxury travel websites. Mobile conversion rates are 65% worse than desktop. WhatsApp engagement has emerged as a high-performing channel for mobile visitors, familiar, low-friction and aligned with how this audience communicates. Operators deploying WhatsApp as a primary mobile engagement channel have seen 17% increases in mobile conversion rates.
Client result: 17% mobile conversion increase
The Downstream Opportunity Marketing Often Ignores
Close rate is typically treated as a sales problem. Marketing generates the lead. What happens next belongs to someone else. CommVersion's data challenges this directly.
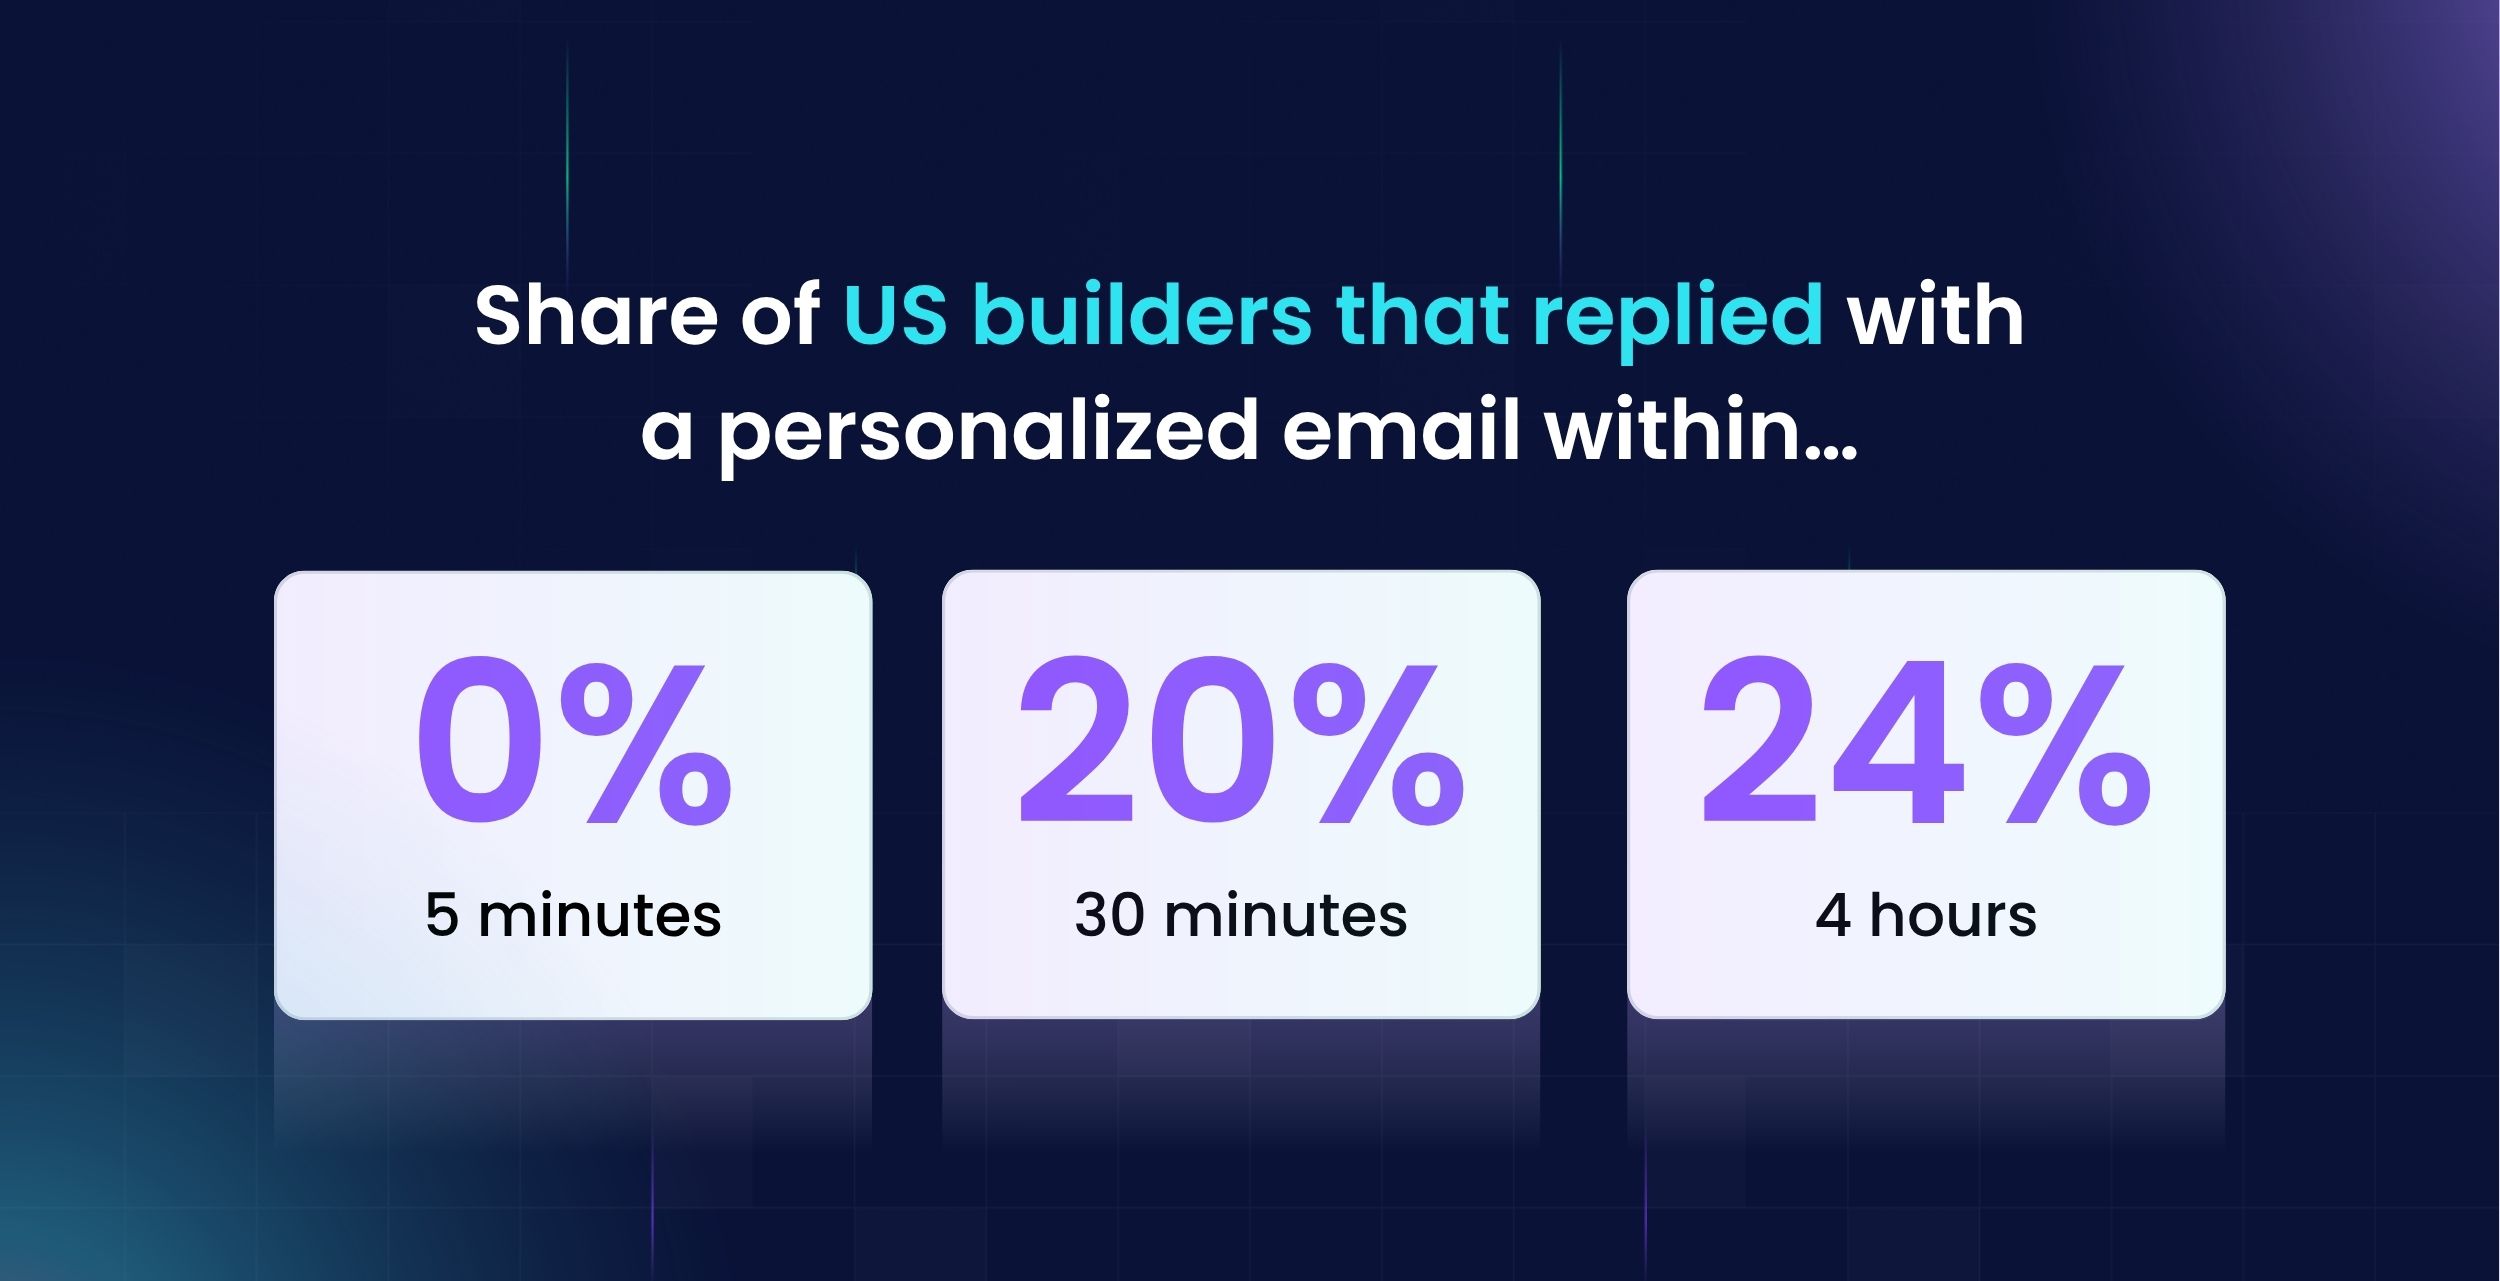
Form leads called back within five minutes close at nearly the same rate as phone leads, rising from 10.8% to 19.1%. This is supported by a cross-vertical study from MIT. The 2x gap between phone and form close rates is not primarily a function of intent. It is a function of response speed.
Your form traffic contains close to the same intent as your phone traffic. The difference is engagement speed before the visitor goes elsewhere.
A 20% improvement in close rate produces a 20% increase in bookings from identical lead volume. No additional acquisition spend required. The best-performing marketing functions treat close rate as a marketing metric, not a sales metric, and own the full funnel accordingly.
The Payoff: From 32% Revenue Decline to 20% Growth
The session closed with the other side of the compound equation. Where the same £10,000 investment now produces eleven bookings and £32,982 given current headwinds, a systematic programme of improvement across all three variables produces a materially different outcome.
Better conversion metrics also support higher CPC bids, which improves traffic quality, which in turn improves conversion. The system begins to work with the marketer rather than against them. The operators capturing disproportionate growth in a difficult market are not those with the largest budgets. They are those with the most systematic approach.
Key Takeaways
- The research journey is more fragmented than ever. Travellers visited 38 pages before booking in 2013. By 2025 that had risen to 277. Visitors arriving on your site are more informed and further into their decision than you might expect.
- The marketing equation is under structural pressure. CPC up 39%, site conversion down 13.2%, close rates down 10.3%. The compound effect is a 32% revenue decline from identical spend.
- 97% of visitors leaving is not a sign of low intent. 30 to 34% visit a direct competitor in the same browsing session. The opportunity is engagement, not more acquisition.
- Small conversion improvements compound materially. Moving from 3% to 3.6% site enquiry rate is a 20% increase in leads from identical traffic and spend.
- The 2x close rate gap is a speed problem. Form leads called within five minutes close at near-identical rates to phone leads. Response time is the variable most teams are not measuring.
- The fundamentals have not changed. Know your audience, understand what matters to them, be present where they are researching. AI changes the tools. It does not change the principles.
See You Next Year
If you manage marketing budget in travel and you were not in the room this year, this recap is the next best thing. Being there in person is better.
Registration for the 2027 event opens early in the new year. Details at travelmarketingconference.com
The complete CommVersion analysis, including all benchmarks, the full marketing equation model and the data behind every finding in this piece, is available to download.